Electric Bush Plane Capstone Design
- Allison K
- Nov 7, 2021
- 4 min read
Updated: Sep 4, 2022
As part of the aerospace engineering major at Penn State, it is required to participate in a capstone project senior year after completing a year of aerospace courses. One of the options for this capstone involves designing an aircraft to meet desired needs from a prompt. It also involves determining what the ethical responsibilities are to the group, to employers, and to society. The first semester involves a preliminary design for an aircraft.
For my project, our group chose the electric bush plane design. This prompt is based off of the RAeS International Light Aircraft Design Competition, which involves creating an aircraft to fly in remote areas to deliver supplies such as medicine, food, and vaccines along with the ability to recharge via solar panels. This competition limits the total weight of the aircraft to 600 kg and the wingspan to 35 ft.
After December 2021, I graduated and did not continue this project. Here is what I worked on for it during my time there:
To start off, benchmarking research was conducted to have a better understanding of the competition and to generate baseline design parameters. This allowed our team to create more constraints for the aircraft along with the information from the competition. From here, a constraint diagram was created in MATLAB to illustrate how our current aircraft design compares to its competitors (Figure 1).

Figure 1. Constraint diagram
Left of stall speed line, above turn performance line, above ground roll distance line is the ideal case.
This graph is constantly changing as we perform more research and have a more accurate representation of our aircraft.
With this information, a flight profile sketch was created to illustrate key values such as our take off and landing distance, the rate of climb, and cruise speed (Figure 2).

Figure 2. Initial Flight Profile Sketch
The flight profile sketch created from our Concept of Operations (CONOPS) allowed us to then create a hierarchy of requirements for the plane. These requirements are based off of the benchmarking research, the constraints from the competition, and the constraints from the original design prompt. This is demonstrated in a flow diagram for traceability and to visually see the hierarchy (Figure 3).
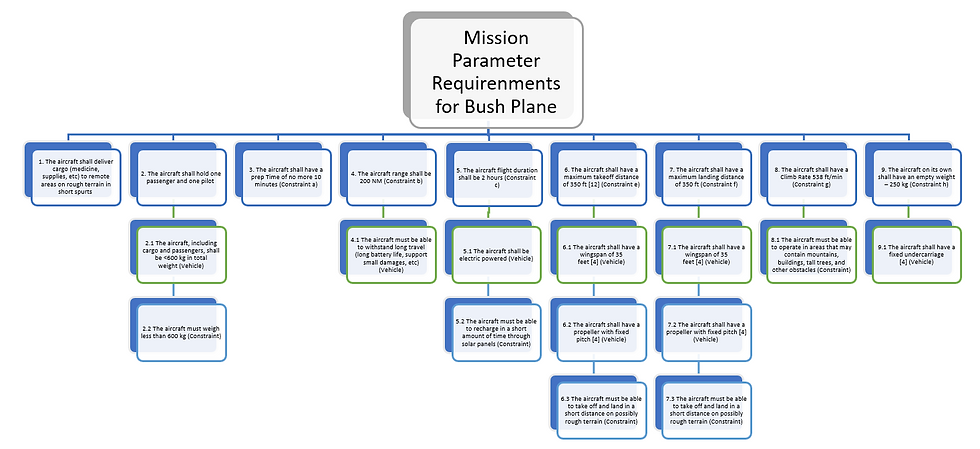
Figure 3. Mission Parameter Requirements
With the research, CONOPS and requirements, multiple graphs were formed in MATLAB such as the Weight vs Lift-to-Drag ratio, Drag as a function of Airspeed, and Power Required as a function of Airspeed. Since these graphs are constantly changing with our new research and requirements, they are not included here.
After more research and calculations based on of our initial benchmarks, I hand-drew a 2D sketch of our electric bush plane for our team to visualize the current design (Figure 4). Currently, we are using this data to help us narrow down an airfoil for the wing and the tail along with calculating dimensions for the fuselage.

Figure 4. Drawing of Bush Plane Dimensions
Multiple trade studies were then conducted by the team to further narrow down the aircraft configuration.
The first trade study involved determining the length of the flaps for the plane's wings. The flaps are necessary on our plane in order to generate enough lift. The results are shown in a heat map in Table 1 and Table 2.
Table 1. Heat Map for Flap Location Takeoff

Table 2. Heat Map for Flap Location Landing

A heat map was used for all the trade studies to quickly see which option is the best - meaning, the colors are as close to green in every category as they can be. The 70% spanwise flap length proved to be the most ideal for our aircraft.
The second trade study conducted involved determining the airfoil taper for the wing. Table 3 illustrates the performance parameters taken into consideration when conducting this study. These values are calculated from the MATLAB code with the most up-to-date data at the time of the study.
Table 3. Performance Parameters
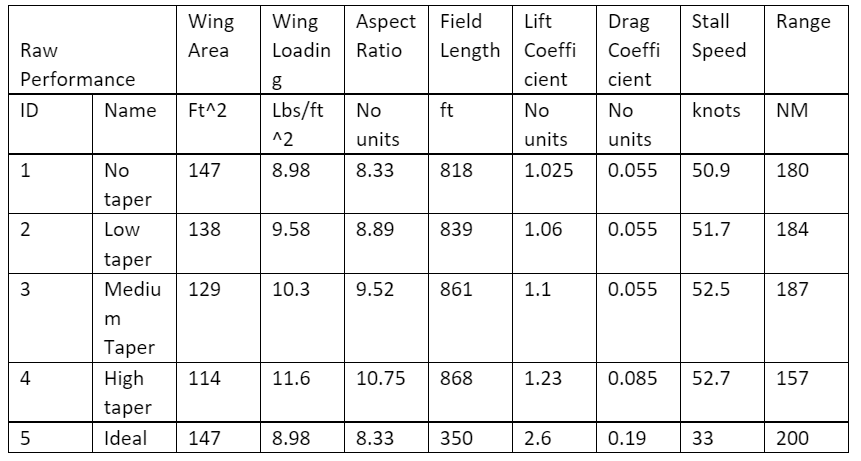
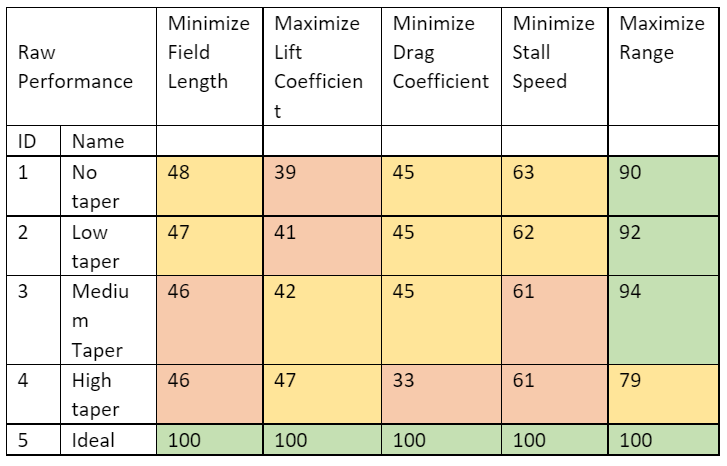
Vehicle Sketch Pad (VSP) was used to visually see the plane design and the affects of changing the taper on the wings. The results are shown in Table 4.
Table 4. Heat Map for Tapered Wing Results
A qualitative matrix was also created for this study to further narrow down the possibilities (Table 5).
Table 5. Qualitative Decision Matrix
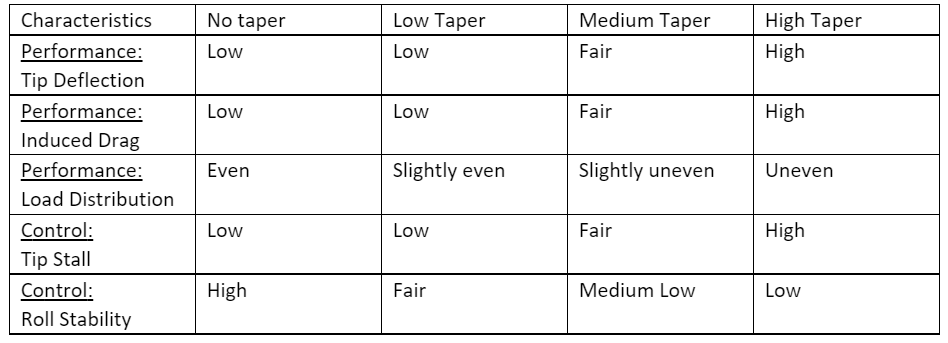
From Table 4 and Table 5, the results are narrowed down to two options: no taper or low tapered wings. Both of these will be taken into consideration as the plane design continues.
The final trade study involved choosing an airfoil for the wing. Five different airfoils were considered - these were chosen from the benchmarking and other common airfoils used for a plane of our general size. To complete the heat map, Xfoil was used to estimate the angle of attack range before stalling. Since Xfoil cannot perform calculations with flaps, AVL was also used to find the rest of the values desired. Table 6 shows the results:
Table 6. Heat Map for Airfoil Selection
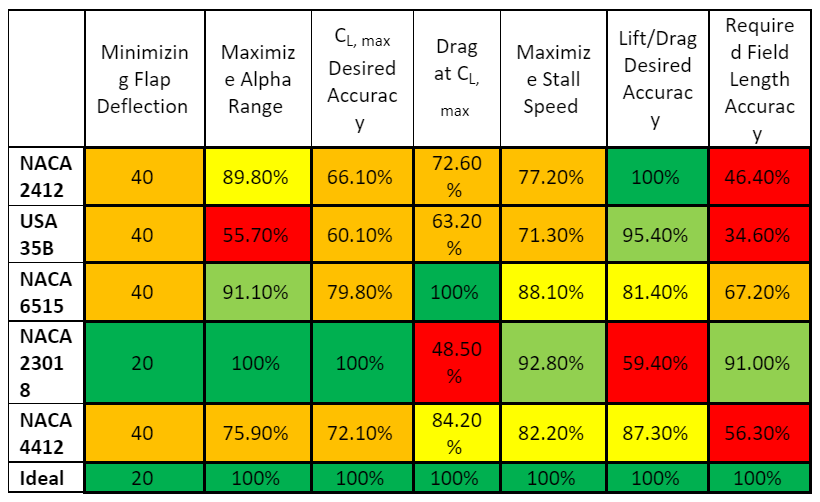
No airfoil is perfect for our design, but the NACA 23018 was chosen so far since it meets the most requirements.
Now, as we go back through our calculations, we are noticing some issues. For the final report, we are basically going back to square-one to make sure our values add up correctly based on our new trade study results.
After recalculations, we have created a final drawing for our end of semester presentation:

Figure 5. Updated Drawing of Plane


Comments